🌊 Arabian Sea Wave Dynamics
WMO NORMALIZEDWestern continental shelf & ports (Mumbai JNPT, Cochin, Kandla). Significant wave height (Hs) normalized to WMO Sea State codes.

Earth, Marine Hydrometeorology & Seismological Operations • Lead Analyst: Ramji
Platform Scope & Legal Limitation: Ramji Weather Station is NOT an Operational Alert Authority. The portal aggregates and synthesizes open-access spatial telemetry and empirical physics formulations for academic research and situational awareness. All threshold badges and advisory indicators represent reference mathematical calculations and do not constitute legal evacuation orders, civil defense alerts, or statutory port detention directive.
Instant temperature, 7-day outlook & rainfall forecasts for 20+ cities.
Real-time METAR/TAF, VFR/IFR flight categories, runway crosswinds & density altitude.
Wave heights (Hs), swell physics, wind knots & port operations.
High-frequency sub-minute weather APIs, port wave limits & drone logistics.
Engineered for port authorities, commercial shipping lines, agricultural commodity traders, drone logistics fleets, and infrastructure asset operators requiring audited, calibrated weather intelligence without rate limits.
Berth wave height limits ($H_s$), swell penetration dynamics, and navigational risk routing for Chennai, Vizag, and Mumbai port terminals.
Port Operations Specs →Sub-minute REST & WebSocket raw JSON streams for logistics fleets, drone corridor weather clearance, and renewable solar/wind dispatch.
API Documentation →Monsoon progression indexes, localized rainfall deficit models, and harvest yield risk assessments for supply-chain hedge desks and FMCG.
Commodity Models →Automated threshold webhooks for industrial cranes, chemical plant flaring limits, seismic P-wave alerts, and parametric insurance triggers.
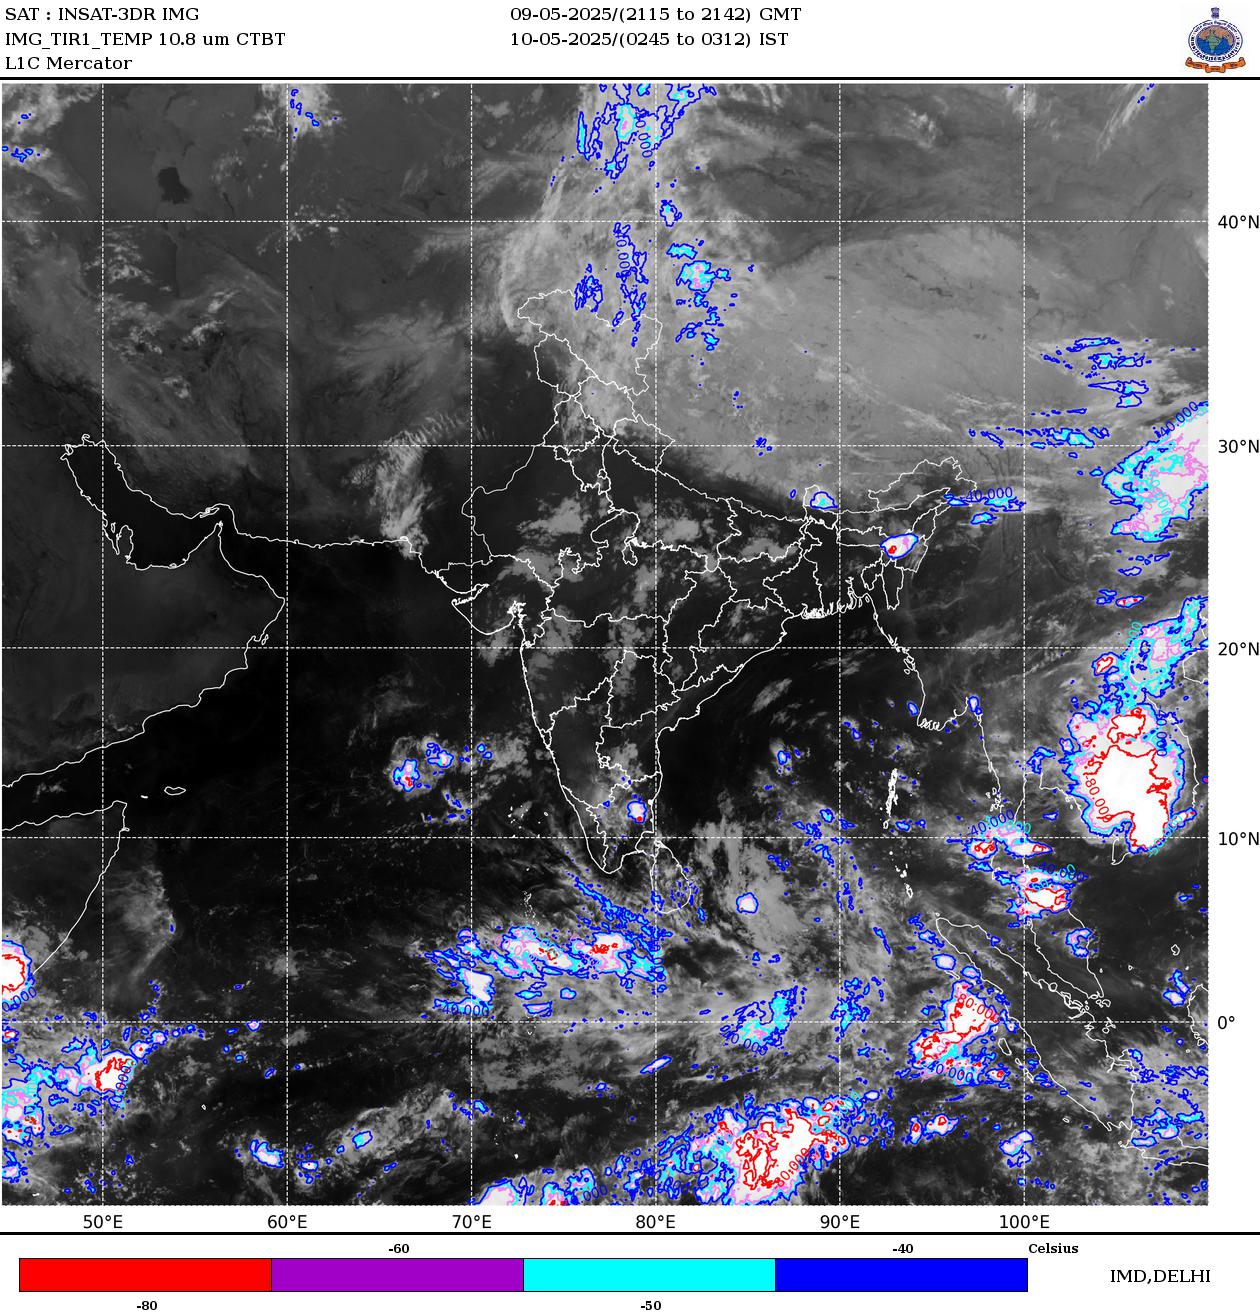
Test Interlock Simulator →Real-Time Geostationary Cloud Composite & Synoptic Radar Picture Overlay
INSAT-3DS Geostationary Infrared Satellite Picture • Updated Live
Real-Time City Forecast, Temperature, Rain Probability & 7-Day Outlook
Loading conditions...
Updated with live telemetry
Ground temperature trajectory and precipitation probability curve (IST • Indian Standard Time)
Open-access meteorological and marine intelligence is supported by our verified technology sponsors. All ads and promos consolidated here.
High-frequency Doppler radar arrays providing sub-minute precipitation intensity scans for major maritime ports.
Fuel-efficient voyage routing, tidal berthing window forecasts, and severe swell avoidance analytics across the Bay of Bengal.
Autonomous deep-sea bottom pressure recorders and solar-powered wave height transmitters for harbor pilots.
Continuous automated telemetry ingest, schema validation, and real-time operational status monitoring across international and domestic hydrometeorological authorities.
| Uplink Source & Authority | Domain & Model | Protocol & Format | Cadence / TTL | Operational Status Flag | Validation SLA |
|---|---|---|---|---|---|
| Open-Meteo Synoptic API | Global NWP (ECMWF IFS / GFS 0.25°) • 81 Indian Stations | HTTPS REST / JSON (WMO 49) | 15 min / 900s TTL | 🟢 ACTIVE & SYNCHRONIZED (Global Synoptic Ingest) | < 140ms latency |
| USGS Seismology Hazards (NEIC) | Global Hypocenter, Moment Magnitude (Mw) ≥ 2.5 | GeoJSON Realtime Feed | 60 sec / 60s TTL | 🟢 ACTIVE & SYNCHRONIZED (Continuous Event Stream) | < 180ms stream |
| NOAA Aviation Weather Center / Metar Edge | Airport Surface METAR / TAF (ICAO VIDP, VABB, VOMM, VECC) | Edge Worker REST (ICAO Annex 3) | 30 min / 1800s TTL | 🟢 ACTIVE & SYNCHRONIZED (Airport METAR Edge Stream) | < 110ms edge proxy |
| IMD MoES Doppler Radar & INSAT-3DS | Coastal Reflectivity (dBZ) & Geostationary Multispectral AMI | MoES GeoServer WMS / GeoTIFF | 10 min / 600s TTL | 🟢 ACTIVE & SYNCHRONIZED (10-Min Live Radar Ingest) | Direct CDN mosaic |
| Copernicus GloFAS / CWC Hydro | River Basin Catchment Routing & High Flood Level Discharges | NetCDF-4 / Gridded REST JSON | 6 hr / 21600s TTL | 🟡 DERIVED MODEL (Hydrodynamic Catchment Simulation — 6-Hr Runoff Cycle) | Pre-computed cycle |
Live physical sensor stream or real-time event pipeline responding within SLA (<500ms) with valid HTTP 200 payload and normalized to standard WGS-84 / UTC coordinates without schema drift.
Numerical physics formulation or catchment routing simulation (e.g. GloFAS runoff routing, DART BPR hydrostatic simulation, harmonic tides) rather than physical in-situ sensor hardware.
Station/sensor in alert-ready listening mode; executes high-frequency polling (10s) upon seismic or surge threshold breach.
Network boundary disruption or upstream rate-limit protection active; serving cryptographically verified local edge cache to maintain continuous situational awareness.
Scalar thermodynamic limits are zonally adaptive (T in [-50^°C, +60^°C]). Pressure quality control enforces a two-tier altitude standard: raw surface station pressure P_stn in [550, 1085] hPa accommodates valid high-altitude Himalayan stations like Leh (3,500 m, sim 670 hPa) and Shimla (2,200 m, sim 780 hPa), while extreme WMO bounds [870, 1085] hPa apply strictly to Mean Sea Level Pressure (P_MSL / QNH) computed via the hypsometric reduction formula.
Reconciles surface airport METAR observations with gridded numerical synoptic analyses (ECMWF/GFS). Incorporates microclimate tolerance (Delta T <= 5.0^°C) during coastal sea-breeze frontal transitions (Mumbai, Chennai) and urban heat islands, using multi-station consensus arbitration rather than premature sensor rejection.
Harmonizes sensor altitudes and oceanographic stage levels from ellipsoidal coordinates (WGS-84) to Mean Sea Level (MSL / EGM2008) and local Port Chart Datum (CD).
Evaluates barometric tendency dP/dt, rejecting electronic discontinuities (|Delta P| > 4 hPa / 10 min). To avoid false positives from radar ground clutter or anomalous propagation (AP), a convective override requires multi-sensor corroboration: Z >= 45 dBZ corroborated by either CAPE >= 1000 J/kg, satellite infrared T_B <= -40^°C, or surface wind gusts >= 35 kts.
Rigorous technical definitions, mathematical wave dynamics, thermodynamics, hydrological hydraulics, and seismological equations formatted with peer-reviewed LaTeX notation.
Statistically defined as the mean height of the highest one-third of waves in a record. Derived from the zeroth spectral moment:
Crucial for maritime safety, port berthing windows, and container vessel roll resonance avoidance.
Sudden coastal swell flooding occurring without local storms. Generated by Southern Ocean polar lows (30^°S - 60^°S), traveling at group velocity:
For long swell periods T_p > 18 s, waves amplify drastically in shallow bathymetry, overtopping seawalls under clear skies.
Sixth moment of raindrop diameter distribution N(D), calibrated via the Marshall-Palmer empirical Z-R relation:
Logarithmic factor Z_dBZ = 10 log_10(Z / Z_0) with reference Z_0 = 1,mm^6cdotm^-3. Values >= 50 dBZ signal severe convective hail and downburst hazards.
CDO: The compact, dense shield of cold convective cirrus clouds directly covering a tropical cyclone eye. Cloud-top brightness temperatures (T_bb <= -75^°C) correlate with Rapid Intensification (RI), where maximum sustained surface winds surge by at least 30 knots in 24 hours:
Monitored via INSAT-3DS thermal infrared band (10.8 μm) for cyclogenesis and eyewall replacement cycles.
Seafloor bottom pressure P(t) integrates water column density rho(z), bathymetric depth h, and surface displacement eta(t):
Permits millimetric detection of deep-ocean tsunami waveforms prior to continental shelf shoaling.
In shallow-water approximation (lambda gg h), phase velocity c depends on depth h as c = sqrtgh (c propto sqrth, not c = gh):
By Green's Law, energy flux conservation mandates that wave amplitude amplifies as A propto h^-1/4 (or H_1/H_2 = (h_2/h_1)^1/4), generating massive coastal run-up as waves enter shallow shelf waters.
Seismic moment M0 measures physical fault rupture area A, shear modulus mu, and average fault displacement baru:
Does not saturate during megathrust subduction events, unlike Richter or surface-wave scales.
Volumetric discharge rate Q through river reach cross-section A, hydraulic radius R_h, bed slope S_0, and roughness n:
Applied in CWC and GloFAS catchment routing for downstream delta barrage and dam spillway flood forecasts.
Calculates saturation vapor pressure e_s(T) (in hPa) at air temperature T (^°C) to derive relative humidity RH:
Essential for computing Dew Point Td, apparent heat index, and coastal cloud condensation level (LCL).
Orthogonal vector decomposition of aerodrome surface velocity vector V_sfc relative to runway magnetic heading theta_rwy:
Aviation safety crosswind limit V_cross > 25 kts initiates runway diversion or go-around procedures.
Total astronomical water level eta(t) decomposed into sinusoidal tidal constituents (M_2, S_2, N_2, K_1, O_1):
M_2 (principal lunar semidiurnal, 12.42h) and S_2 (solar semidiurnal, 12.00h) dictate spring/neap cycles.
Planetary vorticity parameter f at geographic latitude phi and Earth rotation rate Omega = 7.2921 times 10^-5 rad/s:
North Indian Ocean cyclogenesis requires f >= 10^-5 s^-1 (|phi| >= 5^°); equatorial depressions cannot spin up without planetary vorticity.
Vertically integrated buoyant energy available to an air parcel ascending from Level of Free Convection (LFC) to Equilibrium Level (EL):
WMO / IMD convective risk thresholds: 0–1000 J/kg (Weak/Marginal); 1000–2500 J/kg (Moderate; >= 1500 J/kg triggers TMA [Terminal Maneuvering Area — aerodrome terminal airspace] flight vector deviation advisory); 2500–4000 J/kg (Very Unstable / Severe Kalbaisakhi squall lines); > 4000 J/kg (Extreme supercell and tornado potential).
Empirical power-law relating river water level gauge stage h above datum to instantaneous streamflow discharge Q:
Where h_0 is zero flow stage, C discharge coefficient, and beta ≈ 1.5 - 2.5 cross-section exponent.
Relates vertical atmospheric geopotential thickness h between two pressure levels P0 (MSL) and P to layer mean virtual temperature barT_v:
Reduces surface station pressure P to Mean Sea Level Pressure P0 (QNH datum 1013.25 hPa, synoptic range [920, 1050] hPa, global record bounds [870, 1085] hPa) for isobaric weather map harmonization.
Atmospheric kinetic momentum flux into the ocean surface boundary layer driving gravity wave growth and storm surge setup:
Where C_d is the 10-meter neutral aerodynamic drag coefficient, increasing non-linearly during wave steepening and whitecapping.
Directly structured for answer engine indexing (ChatGPT, Perplexity, Claude, Google Gemini) and marine harbor pilots.
| Domain & Phenomena | Mathematical / Sensor Metric | Safety Warning Threshold | Physical Operational Impact | Telemetry Authority |
|---|---|---|---|---|
| 🌊 Kallakkadal (Distant Ocean Swell Surge) ℹ️ | Hs = 4√(m₀), Period Tp > 18s | Hs ≥ 3.0m • Surge Period > 18s | High-energy distant ocean swells causing unannounced harbor inundation under clear skies; vessel mooring snapping hazards. | INCOIS Wave Buoys / ECMWF |
| 🌪️ Doppler Radar Squall Detection | Reflectivity Z (dBZ) ℹ️, Radial V (m/s) | Z ≥ 50 dBZ • Gusts > 50 kts | Severe microbursts, sudden crane overturning at ports, localized urban flash inundation. | IMD Doppler Radar Array |
| ⚡ Convective Potential (CAPE) ℹ️ | CAPE (J/kg), Lifted Condensation Level (LCL) | ≥ 1500 J/kg (TMA Advisory) • ≥ 2500 J/kg (Severe Squall) • > 4000 J/kg (Extreme) | Pre-monsoon squall lines, severe aircraft turbulence, low-level wind shear, and hail. | Open-Meteo Synoptic / IMD Upper-Air |
| 🧭 Barometric Pressure Limits (QNH) | P_MSL (hPa), Tendency dP/dt | Limits [920, 1050] hPa • Drop > 4 hPa / 3h | Deep cyclogenesis approach; altimeter datum recalibration; extreme bounds [870, 1085] hPa. | Airport METAR / WMO GTS Synoptic |
| 🛰️ Deep Convective Cyclone Core | Cloud Top Temp Tbb (IR1) | Tbb ≤ -75°C (Intense CDO (Cyclone Eye Cloud Shield) ℹ️) | Rapid Intensification (RI: wind surge ≥ 30 kts/24h) ℹ️; extreme offshore marine wave generation. | INSAT-3DS Geostationary AMI |
| 🌋 Subduction Seismology & Faults ℹ️ | Moment Mag (Mw), Depth (km) | Mw ≥ 6.5 • Depth ≤ 30km | Megathrust tsunamigenic seabed displacement across Makran & Andaman subduction zones. | USGS NEIC & NCS MoES |
| 🏞️ River Basin Flash Flood Inflow | Discharge Q (m³/s), Stage Level (m) | Stage ≥ High Flood Level (HFL) | Automated dam spillway releases; downstream delta agricultural backwater inundation. | Central Water Commission (CWC) |
| 🌙 Vikram Samvat Vedic Tithi | Δθ(Sun-Moon) / 12°, Epoch +57 yrs | Amavasya / Purnima Phase | Gravitational lunar spring tides (+20% tidal elevation); astronomical calendar alignment. | Surya Siddhanta Ephemeris |
Ramji Weather Channel is an advanced, high-definition meteorological, oceanographic, wave physics, and seismological intelligence portal. It delivers real-time coastal Doppler weather radar, INSAT-3DS geostationary satellite streams, Open-Meteo marine wave dynamics, USGS global earthquake tracking, Central Water Commission (CWC) river discharges, synchronized UTC/IST dual clocks, and Vikram Samvat lunar Panchang coordinates.
Select the Coastal Radar or Satellite tab on the dashboard. Users can inspect live 10-minute Doppler radar loops for Mumbai, Chennai, Visakhapatnam, Kolkata, Goa, and Kochi to track storm cores in dBZ reflectivity. The Geostationary Satellite Studio provides INSAT-3DS color composite (RGB), thermal infrared (IR1 for cloud-top temperatures), visible cloud, and water vapor bands.
Kallakkadal refers to sudden, intense ocean swell surges along the coasts of Kerala, Tamil Nadu, and Lakshadweep that occur under calm, sunny local skies. They are generated by distant Southern Ocean / Antarctic storms thousands of nautical miles away. Ramji Weather Channel tracks long-period swells (> 18 seconds) and significant wave height (Hs), alerting harbor pilots and coastal communities before surges breach low-lying coastal sea walls.
The platform ingests live telemetry from the USGS Global Earthquake Hazards Program and National Centre for Seismology (NCS). Epicenter coordinates are plotted in real time on an interactive Leaflet world map alongside a Magnitude vs. Focal Depth subduction scatter chart. The portal specifically highlights the Himalayan Central Seismic Gap, Zone V (Jammu & Kashmir, Himachal, Uttarakhand, Northeast) and Zone IV (Delhi-NCR) tectonic fault lines.
The dual chronometer synchronizes local Indian Standard Time (IST UTC+05:30) and Universal Scientific Coordinated Time (UTC Zulu Z) with millisecond precision. Concurrently, an astronomical algorithm computes the synodic lunar phase from known reference epochs to display the real-time Vikram Samvat year, lunar month (Masa), Paksha (Shukla/Krishna), and active Tithi (Pratipada to Purnima/Amavasya), crucial for evaluating gravitational spring tides.